
In today's competitive market, marketing success is a matter of precision, not luck. The difference between a campaign that fails and one that delivers exponential returns often comes down to one thing: data. While 'data-driven' is a common term, its practical application remains a challenge for many businesses. It’s not just about collecting numbers; it’s about translating raw information into actionable strategies that attract, convert, and retain customers with predictable results.
Effective data-driven marketing moves beyond gut feelings and assumptions. It transforms your marketing function from a cost center into a reliable, measurable growth engine. By systematically analyzing customer behavior, search intent, and campaign performance, you can make informed decisions that allocate resources effectively, personalize user experiences, and significantly improve your return on investment. This analytical approach is essential for any business aiming to achieve sustainable growth, whether you're a local service provider, an e-commerce brand, or a B2B startup.
This article provides a tactical playbook, cutting through abstract theories to deliver practical applications. We will explore 10 powerful, real-world data-driven marketing examples that businesses of any size can adapt and implement. Each example serves as a detailed mini-case study, breaking down the specific objectives, the data sources used, the strategic execution, and the measurable outcomes. You will find a clear blueprint for turning your marketing efforts into a sophisticated, data-backed system designed for repeatable success.
1. Behavioral Segmentation & Audience Clustering
Behavioral segmentation is the practice of dividing your audience into distinct groups based on their actions, interactions, and usage patterns. Rather than relying solely on demographic data like age or location, this data-driven marketing example uses high-intent signals such as purchase history, website analytics, and feature engagement to create nuanced audience clusters. It transforms a one-size-fits-all marketing approach into a series of personalized, relevant conversations.
For an e-commerce brand, this could mean segmenting users who frequently browse a specific product category but never purchase, then targeting them with a unique discount or social proof advertisement. For a B2B SaaS company, it might involve clustering leads based on which features they use most during a free trial, enabling hyper-relevant onboarding emails that increase conversion rates.
Strategic Breakdown & Implementation
This tactic moves beyond basic personalization to deliver experiences that resonate with a user's specific journey and intent. The core objective is to improve engagement and conversion rates by aligning messaging with demonstrated user behavior.
- Data Sources: Google Analytics 4 (user engagement events), CRM data (purchase history, lead scores), email marketing platforms (open/click rates), and product analytics tools.
- Key Metrics: Conversion rate per segment, customer lifetime value (CLV) by cluster, and engagement rate (e.g., email open rates, time on page).
- Actionable Takeaway: Start by defining 3-5 core segments based on high-value actions. A local service business, for instance, could create clusters for "High-Intent Searchers" (visited a service and pricing page) versus "Information Seekers" (read multiple blog posts). Test different ad copy and landing page offers for each group to validate your assumptions and drive qualified leads. Understanding these clusters is a foundational step in crafting a powerful brand awareness strategy for targeted audiences.
2. Predictive Analytics for Lead Scoring & Conversion
Predictive analytics applies machine learning models to historical customer data to forecast which leads are most likely to convert. This data-driven marketing example moves beyond simple lead grading by analyzing complex patterns in prospect characteristics, engagement behaviors, and past conversion outcomes. It allows sales and marketing teams to prioritize high-probability opportunities, enabling smarter nurturing and faster sales cycles.
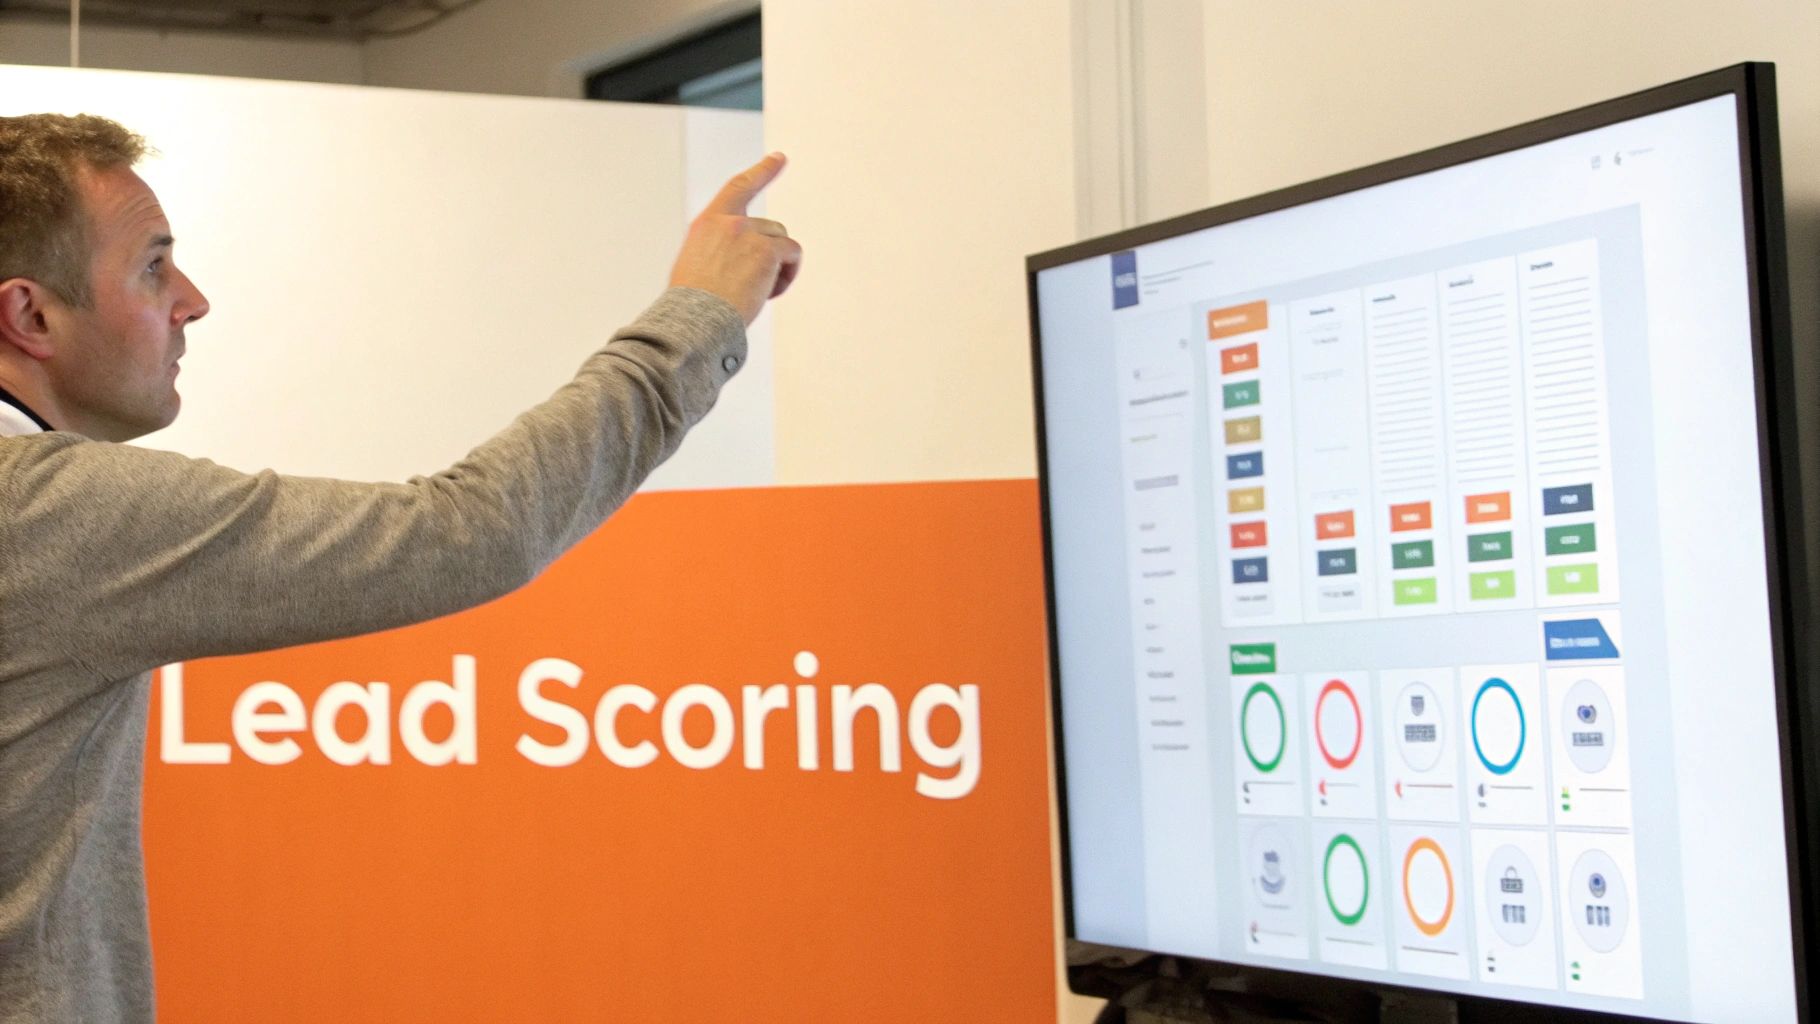
For a B2B software company, this means automatically scoring inbound demo requests based on company size, job title, and website behavior to route top-tier leads directly to senior account executives. A professional service firm could use this model to predict which consultation requests are most likely to become high-value clients, focusing initial follow-up on the most promising inquiries and improving resource allocation.
Strategic Breakdown & Implementation
This tactic operationalizes data to focus finite sales and marketing resources where they will generate the highest return. The core objective is to accelerate the sales pipeline and increase conversion efficiency by systematically identifying and prioritizing the most qualified leads.
- Data Sources: CRM data (historical conversion outcomes, firmographics), website analytics (pages visited, time on site), marketing automation platforms (email engagement, content downloads), and third-party data enrichment tools.
- Key Metrics: Lead-to-opportunity conversion rate, sales cycle length, pipeline velocity, and customer acquisition cost (CAC).
- Actionable Takeaway: Begin by identifying your top 10-15 known conversion drivers (e.g., specific content downloads, pricing page visits, company industry). Use these as initial inputs for a simple predictive model within your CRM or a tool like HubSpot. It's crucial to create a feedback loop where the sales team regularly validates the model's accuracy, allowing you to adjust scoring thresholds and improve predictive power over time.
3. Search Intent Analysis & Content Mapping
Search intent analysis is the process of deciphering the primary goal a user has when typing a query into a search engine. This data-driven marketing example involves categorizing keywords by their underlying intent—informational, commercial, transactional, or navigational—and creating content that directly answers that need. Instead of just targeting keywords, this strategy focuses on matching the user's stage in the buyer journey, dramatically improving rankings, click-through rates, and user satisfaction.
For a local service business, this means creating specific service and location pages for users with commercial intent, such as "plumber in brooklyn." For a B2B company, it involves developing in-depth guides and whitepapers to capture users with informational intent, such as "what is a crm system." By aligning content format and messaging with user intent, businesses ensure they are a helpful resource, not just a search result.
Strategic Breakdown & Implementation
This tactic transforms SEO from a keyword-focused game into a user-centric science. The core objective is to gain organic visibility by providing the most relevant and useful answer for a specific query, thereby earning Google's trust and a higher ranking.
- Data Sources: Google Search Console (query data), Google SERP analysis (top-ranking content formats), SEO tools like Ahrefs or Semrush (intent classifiers), and "People Also Ask" sections.
- Key Metrics: Organic rankings for target keywords, click-through rate (CTR) from search results, bounce rate, and conversion rate from organic traffic.
- Actionable Takeaway: Use Google Search Console to find high-impression, low-CTR keywords. Analyze the SERP for these queries to understand the dominant intent. If Google is showing "how-to" guides and your page is a sales page, you have an intent mismatch. Rework your content to match the format and depth of the top-ranking results. This is a foundational element of effective e-commerce content marketing strategies and applies to nearly every business model.
4. Attribution Modeling & Multi-Touch Campaign Measurement
Attribution modeling is the analytical process of determining which marketing touchpoints should receive credit for a conversion. Instead of giving 100% of the credit to the final click before a purchase (last-touch attribution), this data-driven marketing example uses models to distribute value across the entire customer journey. This reveals the true impact of top-of-funnel content, mid-funnel social engagement, and bottom-funnel ads, providing a holistic view of your marketing mix.
For a B2B SaaS company, this might reveal that while PPC ads close deals, a series of blog posts and a webinar were crucial early touchpoints for their highest-value customers. An e-commerce brand might discover that social media ads, which rarely get the last click, are instrumental in introducing new products that later convert through organic brand searches. It helps marketers justify investment in channels that assist conversions rather than just closing them.
Strategic Breakdown & Implementation
This tactic shifts budget allocation from a guessing game to a calculated science, ensuring every marketing dollar is invested for maximum impact across the funnel. The core objective is to understand the synergistic effect of all marketing channels and optimize the entire customer acquisition path, not just the final step.
- Data Sources: Google Analytics 4 (especially its data-driven attribution model), CRM platforms (e.g., Salesforce, HubSpot), call tracking software (like CallRail), and marketing automation tools (e.g., Marketo).
- Key Metrics: Cost Per Acquisition (CPA) by channel, Return on Ad Spend (ROAS) based on different models, and assisted conversions.
- Actionable Takeaway: Start simple. Before diving into complex custom models, implement a linear or time-decay attribution model in Google Analytics. Compare its insights to your default last-click data. For many businesses, this initial shift alone uncovers valuable insights, such as the previously hidden role that organic social media or early-funnel content marketing plays in generating eventual high-value conversions.
5. Keyword Clustering & Topic Modeling for Content Ecosystems
Keyword clustering is a data-driven content strategy that involves grouping related keywords into topics and subtopics. This structure is used to build an interconnected content ecosystem where a comprehensive "pillar" page is supported by multiple "cluster" content pieces. This model uses semantic analysis and search volume data to identify content gaps, structure your site's information architecture, and establish topical authority with search engines.
For a B2B HR software company, this means creating a pillar page on "Employee Onboarding" and supporting it with cluster articles on specific subtopics like "onboarding checklists," "compliance for new hires," and "best onboarding software." Similarly, a local plumbing business could build a pillar on "Common Plumbing Problems," with dedicated cluster pages for leaks, clogs, and low water pressure, creating a comprehensive resource for potential customers.
Strategic Breakdown & Implementation
This tactic shifts the focus from ranking for individual keywords to dominating entire topics. The core objective is to signal deep expertise to both search engines and users, which boosts organic rankings, improves user experience, and drives qualified traffic for a wide range of related search queries.
- Data Sources: SEO tools (Ahrefs, Semrush for keyword and topic research), Google Search Console (query data), and competitive analysis tools.
- Key Metrics: Topical authority (measured by average ranking position for a keyword cluster), organic traffic to the content hub, and conversion rates from cluster content.
- Actionable Takeaway: Start by identifying a core business offering and use an SEO tool to find related subtopics and questions people search for. For instance, a law firm specializing in auto accidents can create a pillar page on "Auto Accident Claims" and build out cluster content for "proving liability," "negotiating with insurance," and "calculating settlement amounts." Structure your content with strategic internal links: the pillar must link out to every cluster, and every cluster must link back to the pillar. This is a foundational element in any advanced search engine optimization strategy.
6. Customer Journey Mapping Using Analytics Data
Data-driven customer journey mapping involves visualizing the complete path a customer takes—from initial awareness to final conversion—using actual behavioral data instead of assumptions. This approach moves beyond theoretical diagrams to uncover how customers really interact with your brand across different touchpoints. By analyzing analytics, CRM, and sales data, you can identify common drop-off points, successful conversion paths, and the channels that have the most impact.
For a professional service firm, this might reveal that 90% of successful client journeys involve a visit to the Google reviews or testimonials page, highlighting the need to feature social proof prominently. An e-commerce brand could discover that targeted email follow-ups 48 hours after an initial site visit are the most effective re-engagement signal, far more than social media ads. This level of insight allows businesses to allocate resources to the moments that truly matter.
Strategic Breakdown & Implementation
The primary goal of this data-driven marketing example is to optimize the customer experience by understanding and improving the actual paths users take. By identifying friction points and successful sequences, you can refine your content strategy, channel investments, and messaging priorities to guide more users toward conversion.
- Data Sources: Google Analytics 4 (Path exploration reports, user-ID tracking), CRM systems (lead source, touchpoint history), heat mapping tools (Hotjar, Crazy Egg), and product analytics platforms (Mixpanel, Amplitude).
- Key Metrics: Time to conversion, channel attribution, drop-off rate at key stages, and conversion rate by path or sequence.
- Actionable Takeaway: Start by mapping the journey of your most valuable customer segment. Compare the paths of customers who convert against those who don't to identify critical differences. For a B2B company, this could reveal that webinar attendance precedes a sales call in 80% of closed deals, making webinars a top-of-funnel priority. These insights are crucial for developing a cohesive messaging strategy and a powerful brand identity that resonates at each stage.
7. A/B Testing & Multivariate Testing for Optimization
A/B testing is a data-driven method for comparing two versions of a webpage, email, or advertisement against each other to determine which one performs better. By systematically testing variations of individual elements like headlines, images, or call-to-action buttons, you replace guesswork with a scientific process for improving conversions. This approach transforms optimization from a random series of changes into a repeatable engine for growth.
For an e-commerce store, this might involve testing a red "Buy Now" button against a green one to see which color drives more sales. A local service business could test landing page copy that emphasizes "Fast Service" versus "Affordable Rates" to discover which value proposition generates more qualified leads. B2B companies often test different form lengths on their demo request pages to find the sweet spot between gathering data and maximizing submissions.
Strategic Breakdown & Implementation
The core objective is to make incremental, data-validated improvements that compound over time, leading to significant gains in conversion rates and revenue. To deep dive into the specifics of testing methodologies, understanding the differences between Multivariate Testing vs. A/B Testing is crucial for choosing the right strategy. This discipline is a cornerstone of any serious conversion rate optimization (CRO) program.
- Data Sources: Google Analytics, A/B testing platforms (e.g., Optimizely, VWO), landing page builders with built-in testing (e.g., Unbounce, Leadpages), and website heatmaps (e.g., Hotjar).
- Key Metrics: Conversion rate (primary), bounce rate, average order value, click-through rate, and statistical significance level (typically 95% confidence).
- Actionable Takeaway: Formulate a clear hypothesis before launching any test, such as: "Changing the CTA button text from 'Learn More' to 'Get Your Free Quote' will increase form submissions because it speaks directly to user intent." Isolate one major variable per test to ensure you can attribute the performance change correctly. Run the test long enough to collect a statistically significant sample size, avoiding premature conclusions based on small data sets.
8. Competitive Intelligence & Market Share Analysis
Competitive intelligence is the strategic practice of gathering, analyzing, and acting upon data about your market rivals. Instead of operating in a vacuum, this data-driven marketing example involves systematically monitoring competitor strategies, market positioning, and performance to uncover opportunities and threats. It allows businesses to make informed decisions about product development, marketing channels, and brand positioning, turning competitor actions into a roadmap for strategic differentiation.
For a local service business, this could mean discovering a top competitor is investing heavily in Google Local Services Ads, which validates the channel's ROI and informs budget allocation. A B2B SaaS company might analyze a rival’s content marketing and find a significant gap in use-case-specific articles for a key industry, revealing a clear positioning opportunity. This approach transforms reactive decision-making into proactive, evidence-based strategy.
Strategic Breakdown & Implementation
The core objective is to identify market gaps, anticipate competitor moves, and benchmark your performance to gain a sustainable advantage. By understanding the competitive landscape, you can allocate resources more effectively and carve out a unique space in the market.
- Data Sources: SEO tools (like Ahrefs or Semrush for backlink and keyword gap analysis), web analytics platforms (Similarweb for traffic benchmarking), social media listening tools, and competitive intelligence aggregators (Crayon).
- Key Metrics: Share of voice (SOV) for target keywords, competitor ad spend estimates, organic traffic trends, backlink acquisition velocity, and social media engagement rates on key platforms.
- Actionable Takeaway: Identify your 3-5 primary competitors and use a tool like Semrush to run a keyword gap analysis. This will reveal high-intent keywords they rank for that you don't. This isn't about copying their strategy; it's about finding validated, under-served topics that align with your unique value proposition. Create content or landing pages that address these gaps with a superior, more targeted angle to capture qualified traffic.
9. RFM Analysis (Recency, Frequency, Monetary) for Customer Value Segmentation
RFM analysis is a classic, yet powerful data-driven marketing technique used to segment customers based on their transactional behavior. It scores each customer on three key dimensions: how recently they purchased (Recency), how often they buy (Frequency), and the total value of their purchases (Monetary). This framework moves beyond simple revenue metrics, providing a nuanced view of customer loyalty and value that directly informs retention and growth strategies.
For an e-commerce brand, RFM can identify a small segment of “Champions” (high R, F, and M scores) who drive a disproportionate amount of revenue. These customers can then be targeted with VIP programs and exclusive access. Conversely, a subscription service can use RFM to spot “At-Risk” customers (high historical frequency but low recency), triggering targeted win-back campaigns before they churn.
Strategic Breakdown & Implementation
The core objective of RFM analysis is to allocate marketing resources efficiently by focusing on the customers most likely to deliver high lifetime value. It enables businesses to tailor their messaging, offers, and service levels based on a customer's proven value and engagement patterns.
- Data Sources: CRM systems (customer purchase history), e-commerce platforms like Shopify or WooCommerce (transactional data), and payment processors (monetary value data).
- Key Metrics: Customer Lifetime Value (CLV) per RFM segment, churn rate by segment, and repeat purchase rate for targeted campaigns.
- Actionable Takeaway: Start by segmenting your customer base into a few core RFM groups. For example, a local service business can identify "Recent High-Value Clients" (high R and M, low F) and implement a follow-up campaign to encourage repeat business and referrals. Meanwhile, "Sleeping Dogs" (low R, F, M) can be enrolled in a low-cost, automated re-engagement email sequence. This focused approach maximizes ROI by prioritizing high-potential customer segments.
10. Conversion Rate Optimization (CRO) & Landing Page Personalization
Conversion Rate Optimization (CRO) is a systematic process of using analytics and user feedback to improve the performance of your website. When combined with personalization, this data-driven marketing example evolves from a one-size-fits-all approach to creating dynamic experiences tailored to individual user segments. It leverages data on traffic source, device, location, and user intent to deliver personalized messaging, offers, and calls-to-action that significantly boost conversions.

For instance, a B2B SaaS company might show a landing page focused on security and scalability to visitors from enterprise-level IP addresses, while displaying a version that highlights affordability to traffic from SMB-related blogs. Similarly, an e-commerce brand could show a different hero image and headline to mobile users versus desktop users, recognizing the distinct browsing contexts and increasing mobile conversion rates. These small, targeted adjustments compound over time to drive substantial revenue growth.
Strategic Breakdown & Implementation
The core objective is to reduce friction in the user journey and increase the percentage of visitors who complete a desired action, such as making a purchase or filling out a form. Personalization amplifies CRO efforts by ensuring the content is maximally relevant to the user viewing it. Implementing proven 10 Essential Landing Page Optimization Best Practices is crucial for any data-driven marketer aiming for higher conversion rates.
- Data Sources: Google Analytics 4 (traffic source, device category, demographics), heat mapping tools (like Hotjar or VWO), user session recordings, A/B testing platforms (Optimizely), and CRM data (lead industry, company size).
- Key Metrics: Conversion rate (by segment, traffic source, or device), bounce rate, average order value (AOV), and lead quality score.
- Actionable Takeaway: Begin by segmenting your landing page traffic by its source. Create distinct page variations for paid search traffic versus organic SEO traffic. The paid search landing page should have a high-impact headline that matches the ad copy and a clear, compelling offer. The organic page can focus more on educational content that builds trust before presenting the call-to-action. This aligns your page with user intent and a strong value proposition statement example to maximize performance.
From Data Points to Strategic Direction
The data-driven marketing examples explored here illustrate a fundamental shift from assumption-based marketing to an evidence-led strategic function. Success today is defined by a continuous cycle of asking incisive questions, gathering the right data, extracting actionable insights, and executing with precision.
This approach underscores that data is not merely a byproduct of business operations; it is the raw material for building a sustainable competitive advantage. It's about building integrated systems that transform raw information into a deep, dynamic understanding of customer behavior, market trends, and performance drivers. The critical pivot for any business is moving from passive data collection to active, strategic application. Your Google Analytics account holds more than just traffic numbers; it contains the digital body language of your audience. Your CRM is more than a contact list; it’s a detailed history of your customer relationships.
The most successful strategies detailed here don’t require impossibly large budgets or proprietary technology. They are born from a commitment to a few core principles:
- Start with a Clear Question: Effective data analysis begins not with a spreadsheet, but with a specific business problem. "How can we reduce cart abandonment?" or "Which content topics generate the most qualified leads?" are focused questions that lead to meaningful insights.
- Integrate and Synthesize Data: The real power emerges when you connect disparate data sources. Combining website behavior (Analytics) with purchase history (CRM) and ad performance (PPC platforms) creates a holistic view that isolated datasets cannot provide.
- Focus on Action, Not Just Analysis: Insights are only valuable when they lead to tangible actions. A predictive lead scoring model is useless if the sales team doesn't use it to prioritize their calls. A/B test results are wasted if the winning variation isn't implemented across all relevant pages.
- Embrace Iteration and Learning: Data-driven marketing is an ongoing process of testing, learning, and refining. Every campaign, content piece, and website change is an opportunity to gather new data and improve your next move. This iterative loop is what builds momentum and drives exponential growth.
Translating these examples into your own strategy starts with small, deliberate steps. Begin by identifying one key area of your business where a lack of data is creating uncertainty. Is it understanding your most valuable customer segments? Proving the ROI of your content marketing? Or optimizing your ad spend for maximum impact? By consistently applying this mindset, you transform marketing from a cost center into a predictable, scalable engine for growth, rooted in a genuine understanding of the people you serve.