
Measuring marketing ROI boils down to a single, critical comparison: the return (net profit generated) versus the investment (total cost of marketing). This calculation reveals how efficiently your spending creates profit, transforming marketing from a perceived cost center into a proven revenue driver. Mastering it is essential for justifying budgets, sharpening strategy, and driving sustainable growth.
Why Measuring Marketing ROI Is a Non-Negotiable Strategy
In an era of abundant data, operating your marketing efforts without clear ROI measurement is a significant unforced error. Calculating your marketing Return on Investment (ROI) isn't a bureaucratic task for a performance report; it is the bedrock of strategic decision-making. It translates your team's work into bottom-line results, answering the fundamental C-suite question: “What was the business impact of this investment?”

Leading businesses don't just track ROI—they build their growth models around it. This data empowers them to defend budgets, allocate resources with surgical precision, and confidently pivot away from underperforming campaigns or channels. It's the mechanism that shifts marketing from hopeful guesswork to a system of data-driven growth.
The Strategic Value of ROI Measurement
A firm grasp on ROI unlocks a level of clarity that delivers a tangible strategic advantage. It allows you to:
- Justify Marketing Spend: Hard ROI figures provide the financial proof needed to secure and protect your marketing budget, demonstrating that marketing is a function that generates revenue, not just consumes it.
- Optimize Budget Allocation: By identifying which channels and campaigns deliver the highest returns, you can intelligently reallocate capital from underperformers to proven winners, maximizing overall impact.
- Improve Strategic Planning: Analyzing historical ROI trends provides a data-informed roadmap for the future, enabling more accurate forecasting and the creation of ambitious yet realistic growth targets.
Without this consistent feedback loop, marketers operate in a vacuum, unable to prove their impact or learn from past performance. A classic challenge, for example, is quantifying the value of top-of-funnel activities. A well-structured brand awareness strategy helps connect these early touchpoints to final business outcomes, even when their direct, immediate ROI is less straightforward.
The guiding principle is that every dollar of marketing spend must be accountable. Measuring ROI elevates marketing from a creative art to a repeatable science, empowering teams to prove their contribution and drive predictable, long-term growth.
Foundational Elements of ROI
Ultimately, ROI analysis always breaks down into two core components: investment and return. A sophisticated understanding of these variables is what separates effective marketers from those who are merely busy.
Investment encompasses far more than ad spend. It includes the fully-loaded cost of your marketing team (salaries and benefits), software subscriptions, agency fees, and content creation expenses. Similarly, return is not simply gross revenue. The true return is the net profit generated after accounting for all associated costs. Mastering these two variables is the first step toward building a measurement framework that reflects the true financial impact of your marketing.
Laying the Groundwork: What Are You Actually Measuring?
Before calculating ROI, you must answer a foundational question: What does a "win" look like for your business? Without a clear, objective definition of success, any resulting ROI figure will be based on assumptions, rendering it useless for strategic decision-making.
This initial step is about constructing a solid framework that connects every marketing dollar to a tangible business outcome.
Defining Your Conversions: Macro vs. Micro
Not all user actions hold equal value, and a robust measurement system must reflect this reality. We typically segment conversions into two categories: high-value business objectives and the incremental steps that lead to them.
Macro-conversions are the primary actions you are driving toward. These are the high-value events that directly impact your bottom line—the finish line of a customer journey.
Depending on your business model, a macro-conversion might be:
- E-commerce: A completed purchase.
- B2B: A signed contract or a demo request from a qualified lead.
- Local Services: A booked appointment or an inbound call for a quote.
Micro-conversions are smaller yet meaningful actions indicating a prospect is moving through the consideration process. They are critical leading indicators that signal positive momentum toward a macro-conversion. Ignoring them means you are missing key parts of the customer journey.
Examples of micro-conversions include:
- Downloading a whitepaper or case study.
- Subscribing to a newsletter.
- Completing a product demo video.
- Adding an item to a cart in an e-commerce store.
Mapping these actions is fundamental to building a marketing funnel that functions as a predictable system. If you need a framework for this, our content marketing strategy template offers a blueprint for connecting content assets to specific stages of the buyer's journey.
Assigning a Monetary Value to Every Action
Once your conversions are defined, the next step is to assign a dollar value to them. This is straightforward for an e-commerce transaction—it's the order value. But how do you value less direct actions, like lead generation?
This requires working backward from a sale using your historical data. Let's walk through a B2B example:
- Determine your average deal size. Let's assume it's $10,000.
- Calculate your lead-to-close rate. If sales closes 1 of every 10 qualified leads, your close rate is 10%.
- Do the math: $10,000 (deal size) x 0.10 (close rate) = $1,000.
An abstract concept—a "qualified lead"—now has a tangible economic value. Every time marketing delivers one, you can confidently state that it contributes an average of $1,000 in potential revenue to the sales pipeline.
This logic can be applied to nearly any conversion. A local service business can calculate the value of an inbound call by tracking how many calls convert into booked jobs. An e-commerce brand can determine the value of a newsletter subscriber by calculating the average revenue generated by that cohort over a specific period.
By defining what you're measuring and assigning it a real monetary value, you build the essential architecture for a credible ROI model. With this foundation, your calculations will be not just accurate, but genuinely actionable.
The Essential Formulas for Calculating Marketing ROI
With your measurement foundation established, you can now apply the mathematical formulas that turn raw data into strategic insights.
While the basic ROI formula is widely known, true strategic power comes from using more nuanced calculations that reflect your specific business model. This approach elevates ROI from a simple vanity metric to a tool for intelligent decision-making.
This chart summarizes the foundational steps we just covered—setting goals, defining conversions, and assigning value. Mastering these is non-negotiable for producing accurate and meaningful ROI calculations.
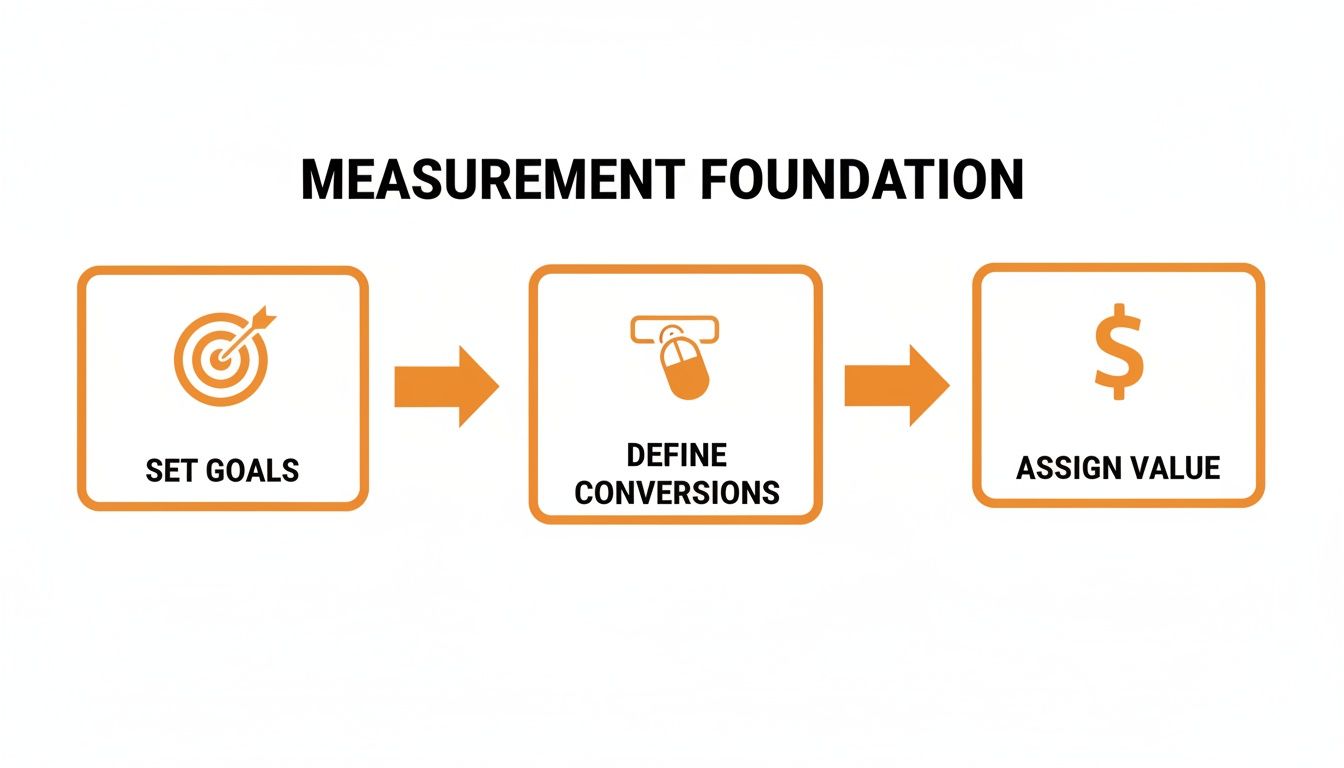
Executing this sequence correctly ensures the numbers you plug into your formulas will yield useful, actionable intelligence.
The Standard ROI Formula
Let's begin with the most direct method for calculating ROI, which provides a high-level snapshot of overall marketing profitability.
The Formula:
(Net Profit from Marketing – Marketing Cost) / Marketing Cost
To express this as a percentage, multiply the result by 100. A result of 4 indicates you generated $4 in net profit for every $1 invested—a 400% ROI.
Let's apply this to a B2B SaaS company:
- Net Profit Attributed to Marketing: $150,000
- Total Marketing Cost: $30,000
- Calculation: ($150,000 – $30,000) / $30,000 = 4
This is an excellent starting point, but it aggregates all marketing efforts. For more actionable insights, you need to get more granular.
Channel-Specific and Campaign-Level ROI
The real strategic value emerges when you apply the same formula to individual channels and campaigns. This is how you identify which activities are true performance drivers and which are merely consuming budget.
The formula remains the same, but you isolate the costs and returns for a specific initiative.
Consider an e-commerce store's Google Ads campaign:
- Revenue from Campaign: $25,000
- Cost of Goods Sold (COGS): $10,000
- Net Profit: $15,000
- Google Ads Spend: $5,000
- Calculation: ($15,000 – $5,000) / $5,000 = 2 (a 200% ROI)
By running this calculation for every channel—SEO, paid social, email marketing—you create a clear performance hierarchy. This data provides the confidence to reallocate your budget, shifting funds from underperforming channels to your proven winners.
Measuring channels with less direct attribution can be more complex. For instance, there are various TV advertising ROI calculation methods that offer different perspectives on quantifying its impact.
A More Holistic View with Customer Lifetime Value (CLV)
A common mistake is focusing exclusively on the initial purchase. This short-term perspective dramatically undervalues channels that cultivate long-term customer relationships.
Incorporating Customer Lifetime Value (CLV) provides a more accurate and strategic picture of marketing's true contribution. CLV represents the total net profit a business can expect from a single customer over their entire relationship with the brand.
The CLV-Adjusted ROI Formula:
(CLV – Marketing Cost Per Customer) / Marketing Cost Per Customer
This formula reframes the "return" from a single transaction to the total value a customer delivers over months or years. It is essential for subscription models, B2B services, and any business reliant on repeat purchases.
Let’s revisit the B2B SaaS company:
- Average CLV: $25,000
- Marketing Cost Per Acquisition (CPA): $5,000
- Calculation: ($25,000 – $5,000) / $5,000 = 4 (a 400% ROI)
Suddenly, an acquisition cost that might have seemed high based on the first transaction is easily justified by the long-term value. This approach prevents the premature cancellation of high-value channels like content marketing or SEO, which often require more time to mature but attract the most loyal and profitable customer cohorts.
Marketing Channel ROI Benchmarks by Industry
Average Return on Investment varies significantly across channels and industries. This table offers a comparative look at what you might expect, helping you set realistic performance benchmarks for your own campaigns.
| Marketing Channel | E-commerce Avg. ROI | B2B Services Avg. ROI | Local Services Avg. ROI |
|---|---|---|---|
| Email Marketing | 38:1 | 30:1 | 25:1 |
| SEO | 22:1 | 15:1 | 18:1 |
| Paid Search (PPC) | 8:1 | 5:1 | 7:1 |
| Social Media Ads | 5:1 | 3:1 | 6:1 |
| Content Marketing | 4:1 | 6:1 | 4:1 |
| Influencer Marketing | 6:1 | 4:1 | 5:1 |
These figures highlight the importance of aligning channel selection with your business model. While email marketing can deliver a staggering 38:1 ROI for e-commerce, a content-driven strategy might be the powerhouse for a B2B service. Focus on what works for your audience and industry rather than chasing abstract benchmarks.
Choosing the Right Attribution Model
Connecting a specific marketing action to a final sale is one of the most challenging aspects of ROI measurement. The customer journey is rarely linear. It's a winding path with multiple touchpoints—a prospect might see a social media ad, later click an organic search result, and finally convert through an email newsletter.
The question is: which touchpoint gets the credit? This is precisely the problem that attribution modeling solves.
An attribution model is a framework of rules used to assign credit for a conversion to various touchpoints along the customer journey. Without a clear model, you risk making flawed decisions, such as cutting the budget for a channel that is critical for introducing new customers while over-investing in the one that merely captures the last click.
Fundamentally, understanding what is marketing attribution is about assigning true value to every step a customer takes on their path to purchase.
A Rundown of Common Attribution Models
Different models provide different narratives about your customer's journey. The optimal model for your business depends on your sales cycle length, business model, and strategic objectives.
- First-Touch Attribution: This model assigns 100% of the credit to the first interaction a customer has with your brand. It is excellent for identifying which channels are most effective at generating initial awareness and driving new leads.
- Last-Touch Attribution: The inverse of first-touch, this model gives all credit to the final touchpoint before a conversion. It helps identify which channels are effective at closing deals but ignores all preceding interactions.
- Linear Attribution: This model distributes credit evenly across every touchpoint. It provides a balanced view that acknowledges the contribution of each interaction, though it may oversimplify their relative importance.
- Time-Decay Attribution: In this model, the touchpoints closest to the conversion receive the most credit. It is a logical choice for businesses with shorter sales cycles, where recent interactions likely have the greatest influence.
- Position-Based (U-Shaped) Attribution: A popular hybrid model that assigns 40% of the credit to the first touch and 40% to the last, distributing the remaining 20% among the intermediate touchpoints. It values both the channel that initiated the journey and the one that finalized it.
Tools like Google Analytics offer a Model Comparison Tool that allows you to visualize how these different models impact channel performance. Comparing a Last-Interaction model to a First-Interaction or Linear model can instantly reveal which channels excel at building awareness versus those that are your primary closers.
How to Pick the Right Model for Your Business
No single attribution model is universally perfect. The goal is to select one that provides a consistent and reliable framework for performance analysis that aligns with the reality of your customer journey.
For instance, a B2B company with a six-month sales cycle would generate misleading data using a Last-Touch model, as it would ignore the value of early-stage interactions like a whitepaper download or webinar attendance. For them, a Position-Based or Time-Decay model would paint a much more accurate picture.
Conversely, an e-commerce business selling low-cost, impulse-buy products might find that a Last-Touch model is sufficient. The journey is short, and the final click often holds the most significance.
The objective is not to find a flawless model, but to choose one, apply it consistently, and understand its inherent biases. This consistency is what enables you to identify trends and make smarter budget allocation decisions over time.
For businesses that rely heavily on channels like Google Ads, getting this right is non-negotiable. A sound attribution model is a cornerstone of any effective paid search advertising strategy, ensuring you are investing in clicks that truly drive revenue. Ultimately, your model should empower you to answer a simple question with confidence: "Where should I allocate my next marketing dollar for the best possible return?"
Building Your ROI Measurement Tech Stack
Accurate ROI measurement depends not on a single magic formula, but on an intelligent, integrated technology stack. Each tool must have a specific purpose and, critically, communicate with the others. Without this integration, you are left with data silos—isolated islands of information that make a holistic view of the customer journey impossible.
You don't need an enormous budget to build an effective stack. The key is a strategic approach to tracking a customer from their first click to their final purchase.

The primary goal is to create a single source of truth. This ensures that when you calculate marketing ROI, you are working with clean, reliable data that directly connects marketing spend to revenue.
The Core Components of an Effective Stack
For most businesses, a powerful measurement stack consists of a few key components. Think of them as layers of insight, each adding more context to your performance data.
A practical, foundational stack includes:
- Web Analytics (e.g., Google Analytics 4): This is your central hub for understanding user behavior—where visitors come from, what they do on your site, and which actions they take.
- CRM (e.g., HubSpot, Salesforce): This system houses all your lead and customer data. Integrating your CRM with your analytics platform allows you to connect anonymous website sessions to real individuals, tracking their entire journey from lead to customer.
- Ad Platform Pixels (e.g., Meta Pixel, Google Ads Tag): These snippets of code are essential for conversion tracking. They monitor post-click activity, closing the loop and informing ad platforms which campaigns are driving tangible results.
The true power lies not in owning these tools, but in integrating them. When your CRM knows precisely which ad campaign generated your largest client, you have achieved true ROI measurement.
The Unsung Hero: UTM Parameters
UTM parameters are the connective tissue of your tracking infrastructure. These simple tags, appended to the end of a URL, tell your analytics platform the exact source of an inbound click.
This allows you to differentiate traffic from an email newsletter, a specific social media post, or a Google Ad campaign. For any organization serious about measuring marketing ROI, consistent UTM tagging is non-negotiable.
It is the difference between saying, "we received some traffic from social media," and knowing, "our LinkedIn post about the new case study generated 15 qualified demo requests."
This level of detail is also invaluable for competitive intelligence. Understanding what works for others can sharpen your own strategy. You can even use some of the best tools for competitor analysis to see how granular tracking informs the broader market landscape.
Graduating to Advanced Visualization
As your business scales, so will the complexity of your data. At a certain point, spreadsheets and native platform reports will no longer suffice. This is when it becomes necessary to adopt data visualization tools.
Platforms like Looker Studio or Tableau can aggregate data from disparate sources—analytics, CRM, ad platforms—into a single, dynamic dashboard. This enables the creation of custom reports that visualize ROI by channel, campaign, or customer segment, transforming raw numbers into clear, actionable insights for your entire organization.
This push for sophisticated tracking is evident across the marketing industry. In the $32.55 billion influencer marketing market, for example, 74% of brands now track direct sales from their campaigns—a clear shift toward mature ROI measurement. Many also use proxy metrics like Earned Media Value, reinforcing the need for a robust tech stack to capture complex data points.
Turning ROI Data Into Actionable Insights
Data collection is only the first step; the real work lies in interpretation and action. The value of measuring marketing ROI is not the number itself, but how that number informs smarter, forward-looking decisions.
Raw data in a dashboard is simply noise. It is the analysis—and the subsequent action—that drives business growth. This is the point where historical reports transform from performance scorecards into a strategic playbook for continuous improvement.
Your role is to translate the numbers into a clear narrative for your team and leadership. A strong ROI report moves beyond basic formulas to highlight the metrics that genuinely inform your next strategic move.
Building Your Optimization Loop
To maximize the value of your ROI data, you need a repeatable process for improvement—an "optimization loop." This framework facilitates a shift from reactive, gut-based decisions to a culture of disciplined, data-backed experimentation. It turns a static ROI report into a dynamic roadmap.
The process is as follows:
- Analyze Performance: Examine your data to identify outliers. Which channels are delivering exceptional returns, and which are underperforming? Where is your Cost Per Acquisition (CPA) becoming unsustainable? Pinpoint the campaigns driving your most valuable customers, particularly by analyzing the LTV-to-CPA ratio.
- Form a Hypothesis: Based on your analysis, create a clear, testable statement. For example: “We hypothesize that reallocating 20% of our budget from Paid Social (low ROI) to high-performing SEO content will decrease our blended CPA by 15% over the next quarter.”
- Test and Measure: Implement your plan. It is crucial to allow the test to run long enough to gather statistically significant data. Isolate variables where possible to ensure you can confidently attribute results to the changes you made.
- Iterate: After the test concludes, analyze the outcomes. Was your hypothesis validated? Regardless of success or failure, you have gained valuable knowledge that will inform your next strategic decision.
This cycle of analyzing, hypothesizing, testing, and iterating is the engine of sustainable growth. It ensures every marketing dollar spent is more intelligent than the last, systematically improving performance over time.
Key Metrics to Guide Your Actions
When presenting your findings, focus on the metrics that lead directly to strategic action. Avoid presenting a single, isolated ROI number. Instead, paint a complete picture that illustrates the relationships between different data points.
For example, a high ROI on a specific channel is positive, but if that channel generates a low volume of leads, its overall business impact may be limited. Conversely, a channel with a more moderate ROI might be your most scalable engine for growth.
Understanding these nuances is essential for building effective demand generation strategies that balance efficiency with volume.
Ultimately, your ROI data should provide the confidence to answer the most critical business questions: Where should we increase investment? Where should we pull back? And what should we test next to accelerate growth?
Frequently Asked Questions About Marketing ROI
Even with a perfect framework, real-world ROI tracking presents challenges and questions. Here are answers to some of the most common issues marketers encounter.
How Often Should I Calculate Marketing ROI?
The optimal reporting frequency depends on your business rhythm and sales cycle.
For an e-commerce business running daily ad campaigns, a tight feedback loop is essential. Weekly or, at most, monthly ROI reporting is crucial for making rapid, tactical adjustments to optimize spend and capitalize on immediate opportunities.
Conversely, for a B2B company with a six-month sales cycle, a weekly report would be misleadingly volatile. A quarterly ROI analysis provides a far more strategic and stable view. This should be supplemented with monthly monitoring of leading indicators like lead volume, pipeline velocity, and Cost Per Acquisition (CPA) to ensure you are on track.
What Constitutes a "Good" Marketing ROI?
This is a common question, and while a general benchmark of a 5:1 ratio (a $5 return for every $1 spent) is often cited, the true answer is more nuanced. A "good" ROI is highly dependent on your industry, profit margins, and business objectives.
The most important benchmark is your own historical performance. The goal should be continuous improvement against your past results, not the pursuit of an arbitrary industry standard.
A high-margin SaaS company might require a 10:1 ratio to be considered successful, whereas a high-growth startup might be content to break even (or even operate at a calculated loss) on marketing spend in the short term to capture market share.
How Can I Measure ROI for Intangible Activities like Brand Awareness?
It is challenging to tie activities like a billboard advertisement or a podcast sponsorship directly to a sale in the short term. The key is to shift focus from measuring direct sales to tracking proxy metrics.
These are quantifiable indicators that signal your brand-building initiatives are having an effect. Monitor metrics such as:
- Branded Search Volume: Are more users searching for your brand name directly in Google?
- Direct Website Traffic: Is there a sustained increase in visitors who navigate directly to your URL?
- Social Media Engagement: Are metrics like follower growth, shares, and mentions trending upward?
- Share of Voice: How does your brand's online presence compare to that of your competitors?
While you won't derive a simple ROI calculation from these activities overnight, you can correlate a sustained lift in these brand metrics with an increase in baseline revenue over time. This approach allows you to build a model for the long-term value of brand investment.